Data Analysis
Andrey Shestakov (avshestakov@hse.ru)
Intoduction1
1. Materials used from machine learning course of Victor Kitov
Course information
Instructor - Andrey Shestakov
Structure:
- lectures, seminars
- assignments: theoretical, labs, competitions
- exam
- Tools
- python 2
- Jupyter Notebook
- numpy, scipy, pandas
- matplotlib, seaborn
- scikit-learn and more
Recommended materials
- The Elements of Statistical Learning: Data Mining, Inference, and Prediction Trevor Hastie, Robert Tibshirani, Jerome Friedman
- Data Mining: The Textbook Charu C. Aggarwal, Springer, 2015.
- Mining Massive Datasets Jure Leskovec, Anand Rajaraman, Jeff Ullman
- Statistical Pattern Recognition. 3rd Edition, Andrew R. Webb, Keith D. Copsey, John Wiley & Sons Ltd., 2011.
- Vorontsov's SHAD video lectures (Russian).
- Vorontsov's textual lectures (Russian).
- Any additional public sources:
- wikipedia, articles, tutorials, video-lectures.
- Practical questions:
Motivation
Motivation

Motivation
Motivation
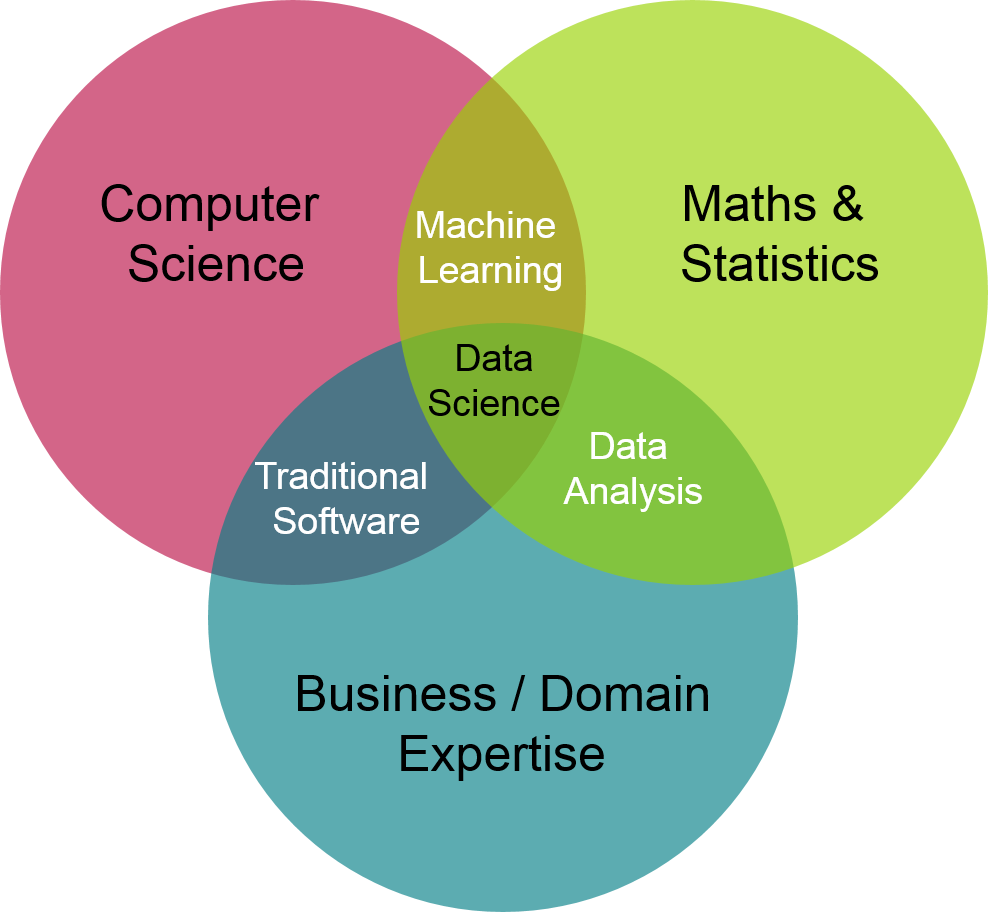
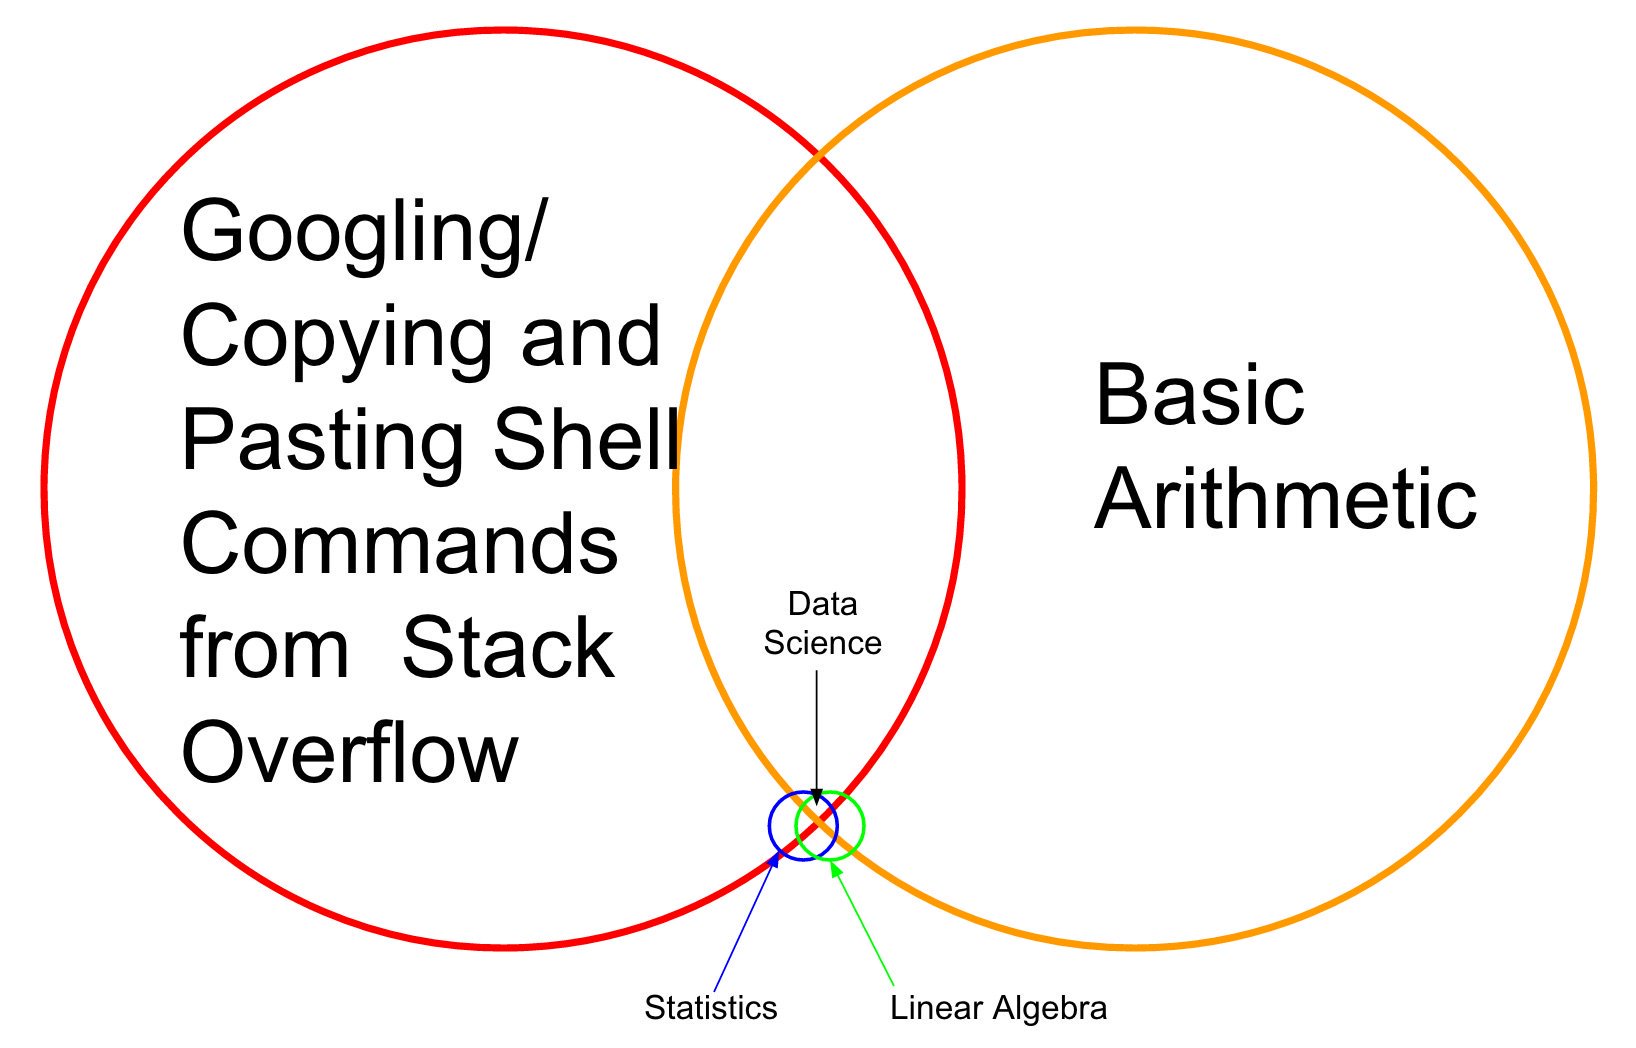
- Data scientist is a highly wanted and well-paid specialization.
- Should use machine learning "apparatus" to extract knowledge from data.

Machine learning?
Machine learning is a field of study that gives computers the ability to learn without being explicitly programmed.
A computer program is said to learn from experience E with respect to some class of tasks T and performance measure P, if its performance P at tasks in T improves with experience E.
Examples
- Spam filtering
- if sender belongs to black-list -> spam
- if contains phrase 'buy now' and sender is unknown -> spam
- ...
- Part-of-speech tagger.
- if ends with 'ed' -> verb
- if previous word is 'the' -> noun
- ...
- ML finds decision rules automatically with labelled data!
Formal problem statement
- Set of objects $O$
- Each object is described by a vector of known characteristics $\mathbf{x}\in\mathcal{X}$ and predicted characteristics $y\in\mathcal{Y}$. $$ o\in O\longrightarrow(\mathbf{x},y) $$
- Task: find a mapping $f$, which could accurately approximate $\mathcal{X}\to\mathcal{Y}$.
- using a finite known set of objects.
- apply model for objects from the test set.
- test set way be known or not.
Specification of known/test sets
Known set:
- supervised learning: $(\mathbf{x}_{1},y_{1}),(\mathbf{x}_{2},y_{2}),...(\mathbf{x}_{N},y_{N})$
- e.g. regression, classification.
- unsupervised learning: $\mathbf{x}_{1},\mathbf{x}_{2},...\mathbf{x}_{N}$
- e.g. dimensionality reduction, clustering, outlier analysis
- semi-supervised learning: $(\mathbf{x}_{1},y_{1}),(\mathbf{x}_{2},y_{2}),...(\mathbf{x}_{N},y_{N}),\,\mathbf{x}_{N+1},\,\mathbf{x}_{N+2},...\mathbf{x}_{N+M}$ If test set objects $\mathbf{x}_{1}',\,\mathbf{x}_{2}',\,...\,\mathbf{x}_{K}'$ are known in advance, then this is transductive learning.
Reinforcement learning
- RL setup:
- a set of environment and agent states $S$;
- a set of actions $A$, of the agent
- $P(s_{t+1}=s'|s_{t}=s,a_{t}=a)$ is the probability of transition from state s to state s' under action a.
- $R_{a}(s,s')$ is the (expected) immediate reward after transition from $s$ to $s'$ with action $a$.
- Well-suited to problems which include a long-term versus short-term reward trade-off
- Applications: robot control, elevator scheduling, games (chess, go, DOTA), etc.
YouTubeVideo('V1eYniJ0Rnk', width=700, height=600)
Visual toy examples
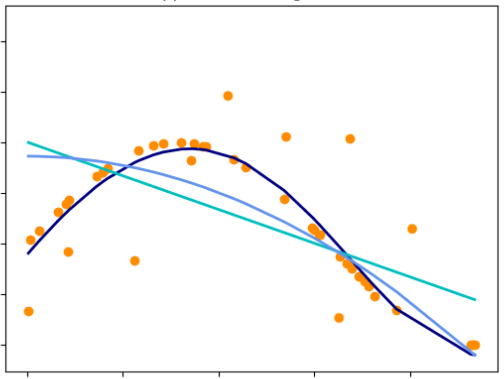
Regression
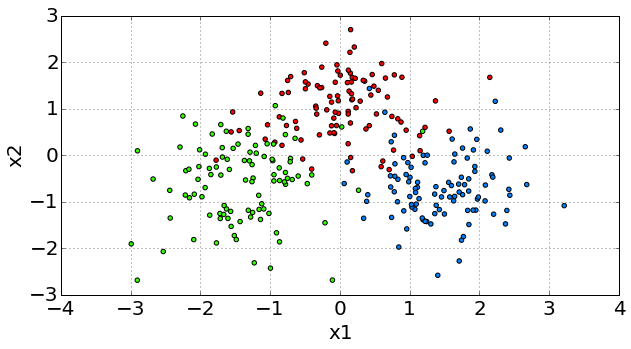
Classificaion
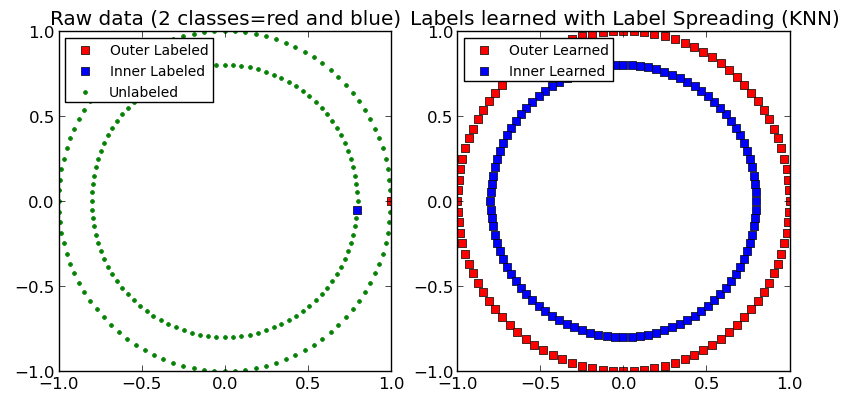
Semi-supervised learning
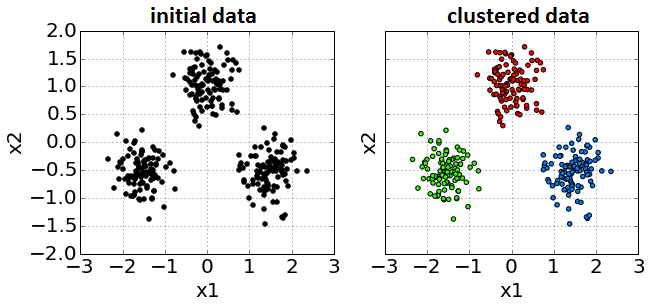
Unsupervised Learning. Clustering
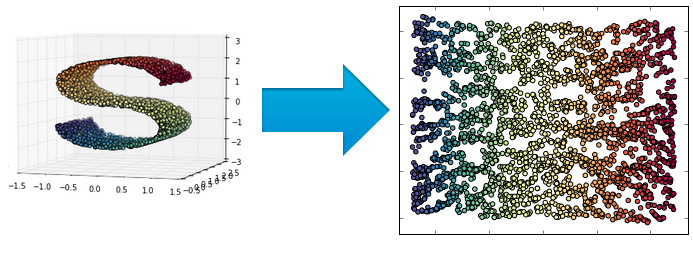
Unsupervised Learning. Dimensionality reduction
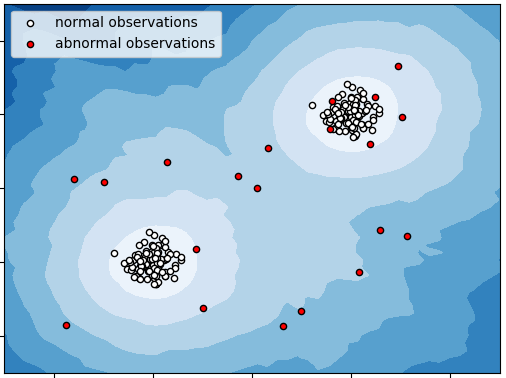
Outlier Detection Task
Recommender Systems
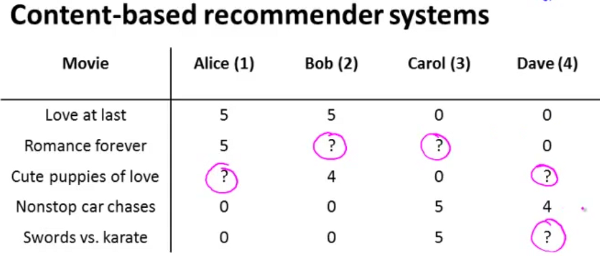
General Problem Statement
- We want to find $f(x):\,X\to Y$.
- How it may be used:
- prediction of $Y$
- qualitative analysis, understanding of $X\to Y$ dependency
- untypical objects detection (where model fails)
- Questions in ML:
- what target $y$ we are predicting?
- how to select object descriptors (features) $x$?
- what is the kind of mapping $f$?
- in what sense a mapping $f$ should approximate true relationship?
- how to tune $f$?
Types of target variable (supervised learning)
- $\mathcal{Y}=\mathbb{R}$ - regression
- e.g. flat price
- $\mathcal{Y}=\mathbb{R}^{M}$ - vector regression
- e.g. stock price dynamics
Types of target variable (supervised learning)
- $\mathcal{Y}=\{\omega_{1},\omega_{2},...\omega_{C}\}$ - classification.
- C=2: binary classification.
- e.g. spam / not spam (ham)
- C>2: multi-class classification
- e.g. identity recognition, activity recognition
- $\mathcal{Y}$ - any subset of $\{\omega_{1},\omega_{2},...\omega_{C}\}$ - labeling
- e.g. news categorization
Types of features
- Full object description $\mathbf{x}\in\mathcal{X}$ consists of individual features $x^{i}\in\mathcal{X}_{i}$
- Types of feature (e.g. for credit scoring):
- $\mathcal{X}_{i}=\{0,1\}$ - binary feature
- e.g. marital status
- $|\mathcal{X}_{i}|<\infty$ - categorical (nominal) feature
- e.g. occupation
- $|\mathcal{X}_{i}|<\infty$ and $\mathcal{X}_{i}$ is ordered - ordinal feature
- e.g.education level
- $\mathcal{X}_{i}=\mathbb{R}$ - real feature
- e.g. age
- $\mathcal{X}_{i}=\{0,1\}$ - binary feature
Function Class. Linear Example
- Function class - parametrized set of functions $F=\{f_{\theta},\,\theta\in\Theta\}$,
from which the true relationship $\mathcal{X}\to\mathcal{Y}$ is approximated.
- Regression: $\widehat{y}=f(x|\theta)$,
- Classification: $\widehat{y}=f(x|\theta)=\arg\max_{c}\left\{ g_{c}(x|\theta)\right\} $, $c=1,2,...C$.
- $c=1,2,...C$: possible classes, $g_{c}(x)$ - score of class $c$, given $x$ called discriminant function
Examples
linear regression $y\in\mathbb{R}$: $$f(x\mathbf{|\theta})=\theta_{0}+\theta_{1}x$$ 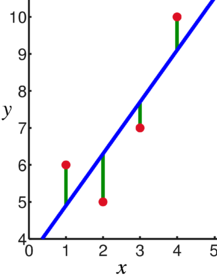 |
linear classification $y\in\{1,2\}$:
\begin{align*}
g_{c}(\mathbf{x}|\theta) & =\theta_{c}^{0}+\theta_{c}^{1}x^{1}+\theta_{c}^{2}x^{2},\,c=1,2.\\
f(\mathbf{x|\theta}) & =\arg\max_{c}g_{c}(x|\theta)
\end{align*}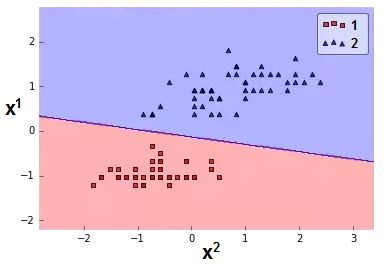 |
|---|
Function Estimation
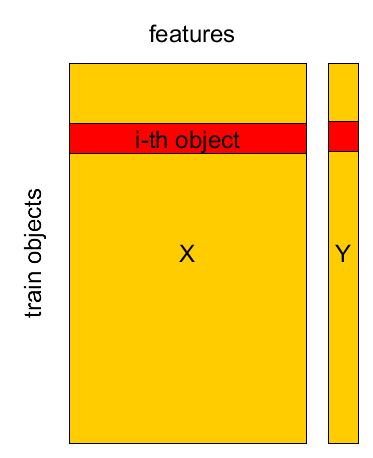
Known Set
Known set: $(\mathbf{x}_{1},y_{1}),...(\mathbf{x}_{M},y_{M})$ <br> design matrix $X=[\mathbf{x}_{1},...\mathbf{x}_{M}]^{T}$, $Y=[y_{1},...y_{M}]^{T}$.

Known Set
Known set: $(\mathbf{x}_{1},y_{1}),...(\mathbf{x}_{M},y_{M})$ <br> design matrix $X=[\mathbf{x}_{1},...\mathbf{x}_{M}]^{T}$, $Y=[y_{1},...y_{M}]^{T}$.
Known Set
Known set: $(\mathbf{x}_{1},y_{1}),...(\mathbf{x}_{M},y_{M})$ <br> design matrix $X=[\mathbf{x}_{1},...\mathbf{x}_{M}]^{T}$, $Y=[y_{1},...y_{M}]^{T}$.
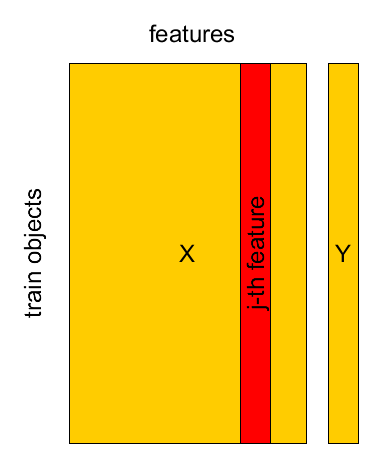
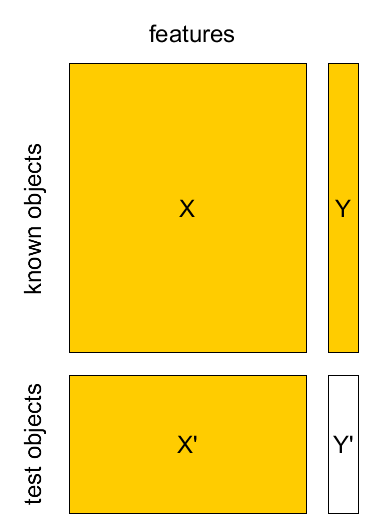
Known set, test set
- Known sample $X,Y$: $(\mathbf{x}_{1},y_{1}),...(\mathbf{x}_{M},y_{M})$
- Test sample $X',Y'$: $(\mathbf{x}_{1}',y_{1}'),...(\mathbf{x}_{K}',y_{K}')$
Score vs loss vs model quality
- In machine learning predictions, functions, objects can be assigned:
- score, rating - this should be maximized
- loss, cost - this should be minimized
- both score and loss can be computed for individual objects
- directly optimized in model
- Model quality measures are used to compare diffrent models' performance on test set
- some of them can not be directly optimized in the model
- usually can not be computed for individual objects
Loss function $\mathcal{L}(\widehat{y},y)$
- Examples:
- classification:
- log-loss $$ \mathcal{L}(\widehat{y},y)=[y=1]\log(p(\hat{y} = 1)) + (1-[y=-1])(1-\log(p(\hat{y}=-1))) $$
- regression:
- MAE (mean absolute error): $$ \mathcal{L}(\widehat{y},y)=\left|\widehat{y}-y\right| $$
- MSE (mean squared error): $$ \mathcal{L}(\widehat{y},y)=\left(\widehat{y}-y\right)^{2} $$
- classification:
Empirical risk
- Want to minimize expected risk: $$ \mathit{\int}\int\mathit{\mathcal{L}(f_{\theta}(\mathbf{x}),y) \cdot p(\mathbf{x},y)d\mathbf{x}dy\to\min_{\theta}} $$
Can minimize only empirical risk $$ L(\theta|X,Y)=\frac{1}{N}\sum_{n=1}^{N}\mathcal{L}(f_{\theta}(\mathbf{x}_{n}),\,y_{n}) $$
Method of empirical risk minimization: $$ \widehat{\theta}=\arg\min_{\theta}L(\theta|X,Y) $$
Estimation of empirical risk
- What is the relationship between $L(\widehat{\theta}|X,Y)$ and $L(\widehat{\theta}|X',Y')$?
- Typically $$ L(\widehat{\theta}|X,Y)<L(\widehat{\theta}|X',Y') $$
- How to get realistic estimate of $L(\widehat{\theta}|X',Y')$?
- separate validation set
- cross-validation
- leave-one-out method
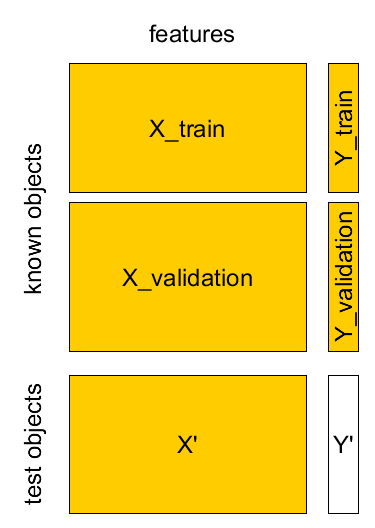
Separate validation set
- Known sample $X,Y$: $(\mathbf{x}_{1},y_{1}),...(\mathbf{x}_{M},y_{M})$
- Test sample $X',Y'$: $(\mathbf{x}_{1}',y_{1}'),...(\mathbf{x}_{K}',y_{K}')$
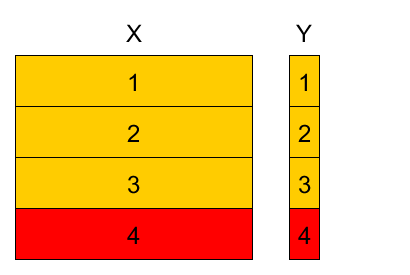
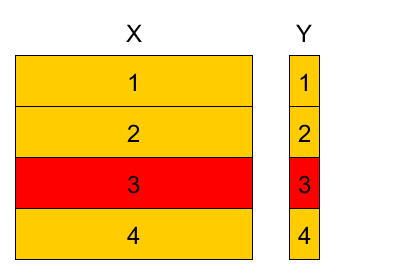
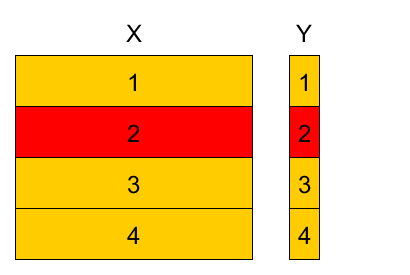
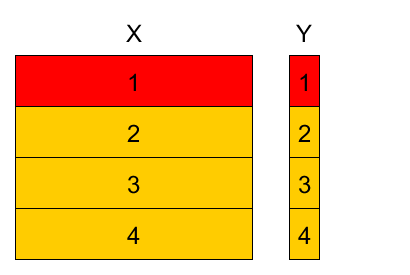
Cross-validation
4-fold cross-validation example
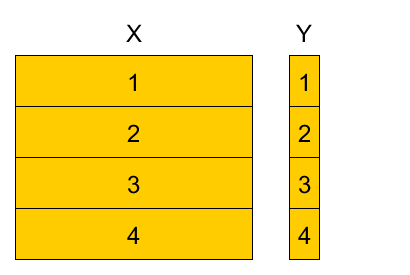
Divide training set into K parts, referred as <
Variants:
- randomly
- randomly with stratification (w.r.t target value or feature value).
4-fold cross-validation example
4-fold cross-validation example
4-fold cross-validation example
4-fold cross-validation example
4-fold cross-validation example
- Denote
- $k(n)$ - fold to which observation $(\mathbf{x}_{n},y_{n})$ belongs $n\in I_{k}$.
- $\widehat{\theta}^{-k}$ - parameter estimation using observations from all folds except fold $k$.
Cross-validation empirical risk estimation
$$\widehat{L}_{total}=\frac{1}{N}\sum_{n=1}^{N}\mathcal{L}(f_{\widehat{\theta}^{-k(n)}}(x_{n}),\,y_{n})$$
For $K$-fold CV we have:
- $K$ parameters $\widehat{\theta}^{-1},...\widehat{\theta}^{-K}$
- $K$ models $f_{\widehat{\theta}^{-1}}(\mathbf{x}),...f_{\widehat{\theta}^{-K}}(\mathbf{x}).$
$K$ estimations of empirical risk: $\widehat{L}_{k}=\frac{1}{\left|I_{k}\right|}\sum_{n\in I_{k}}\mathcal{L}(f_{\widehat{\theta}^{-k}}(\mathbf{x}_{n}),\,y_{n}),\,k=1,2,...K.$
- can estimate variance & use statistics!
Comments on cross-validation
- When number of folds $K$ is equal to number of objects $N$, this is called leave-one-out method.
- Cross-validation uses the i.i.d.(independent and identically distributed) property of observations
- Stratification by target $y$ helps for imbalanced/rare classes.
A/B testing
A/B testing
- Observe test set after the models were built.
- A/B testing procedure:
- divide test objects randomly into two groups - A and B.
- apply base model to A
- apply modified model to B
- compare final results\pause
Cross-validation vs. A/B testing
| cross-validation | A/B testing | |
|---|---|---|
| realism | use retrospective analysis, rely on i.i.d. assumption | full realism |
| overfitting | possible (when use it multiple times) | almost impossible(possible if A/B split is inadequate) |
| costs | uses available data, only computational costs & requires time and resources for collecting | evaluating feedback from objects of groups A and B |
Learning = Representation + Evaluation + Optimization
A Few Useful Things to Know about Machine Learning // Pedro Domingos
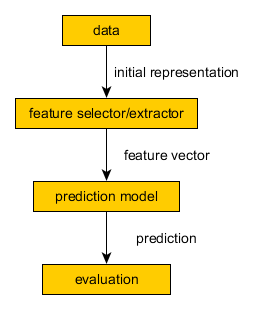
Modelling Pipelines
General Modelling Pipeline
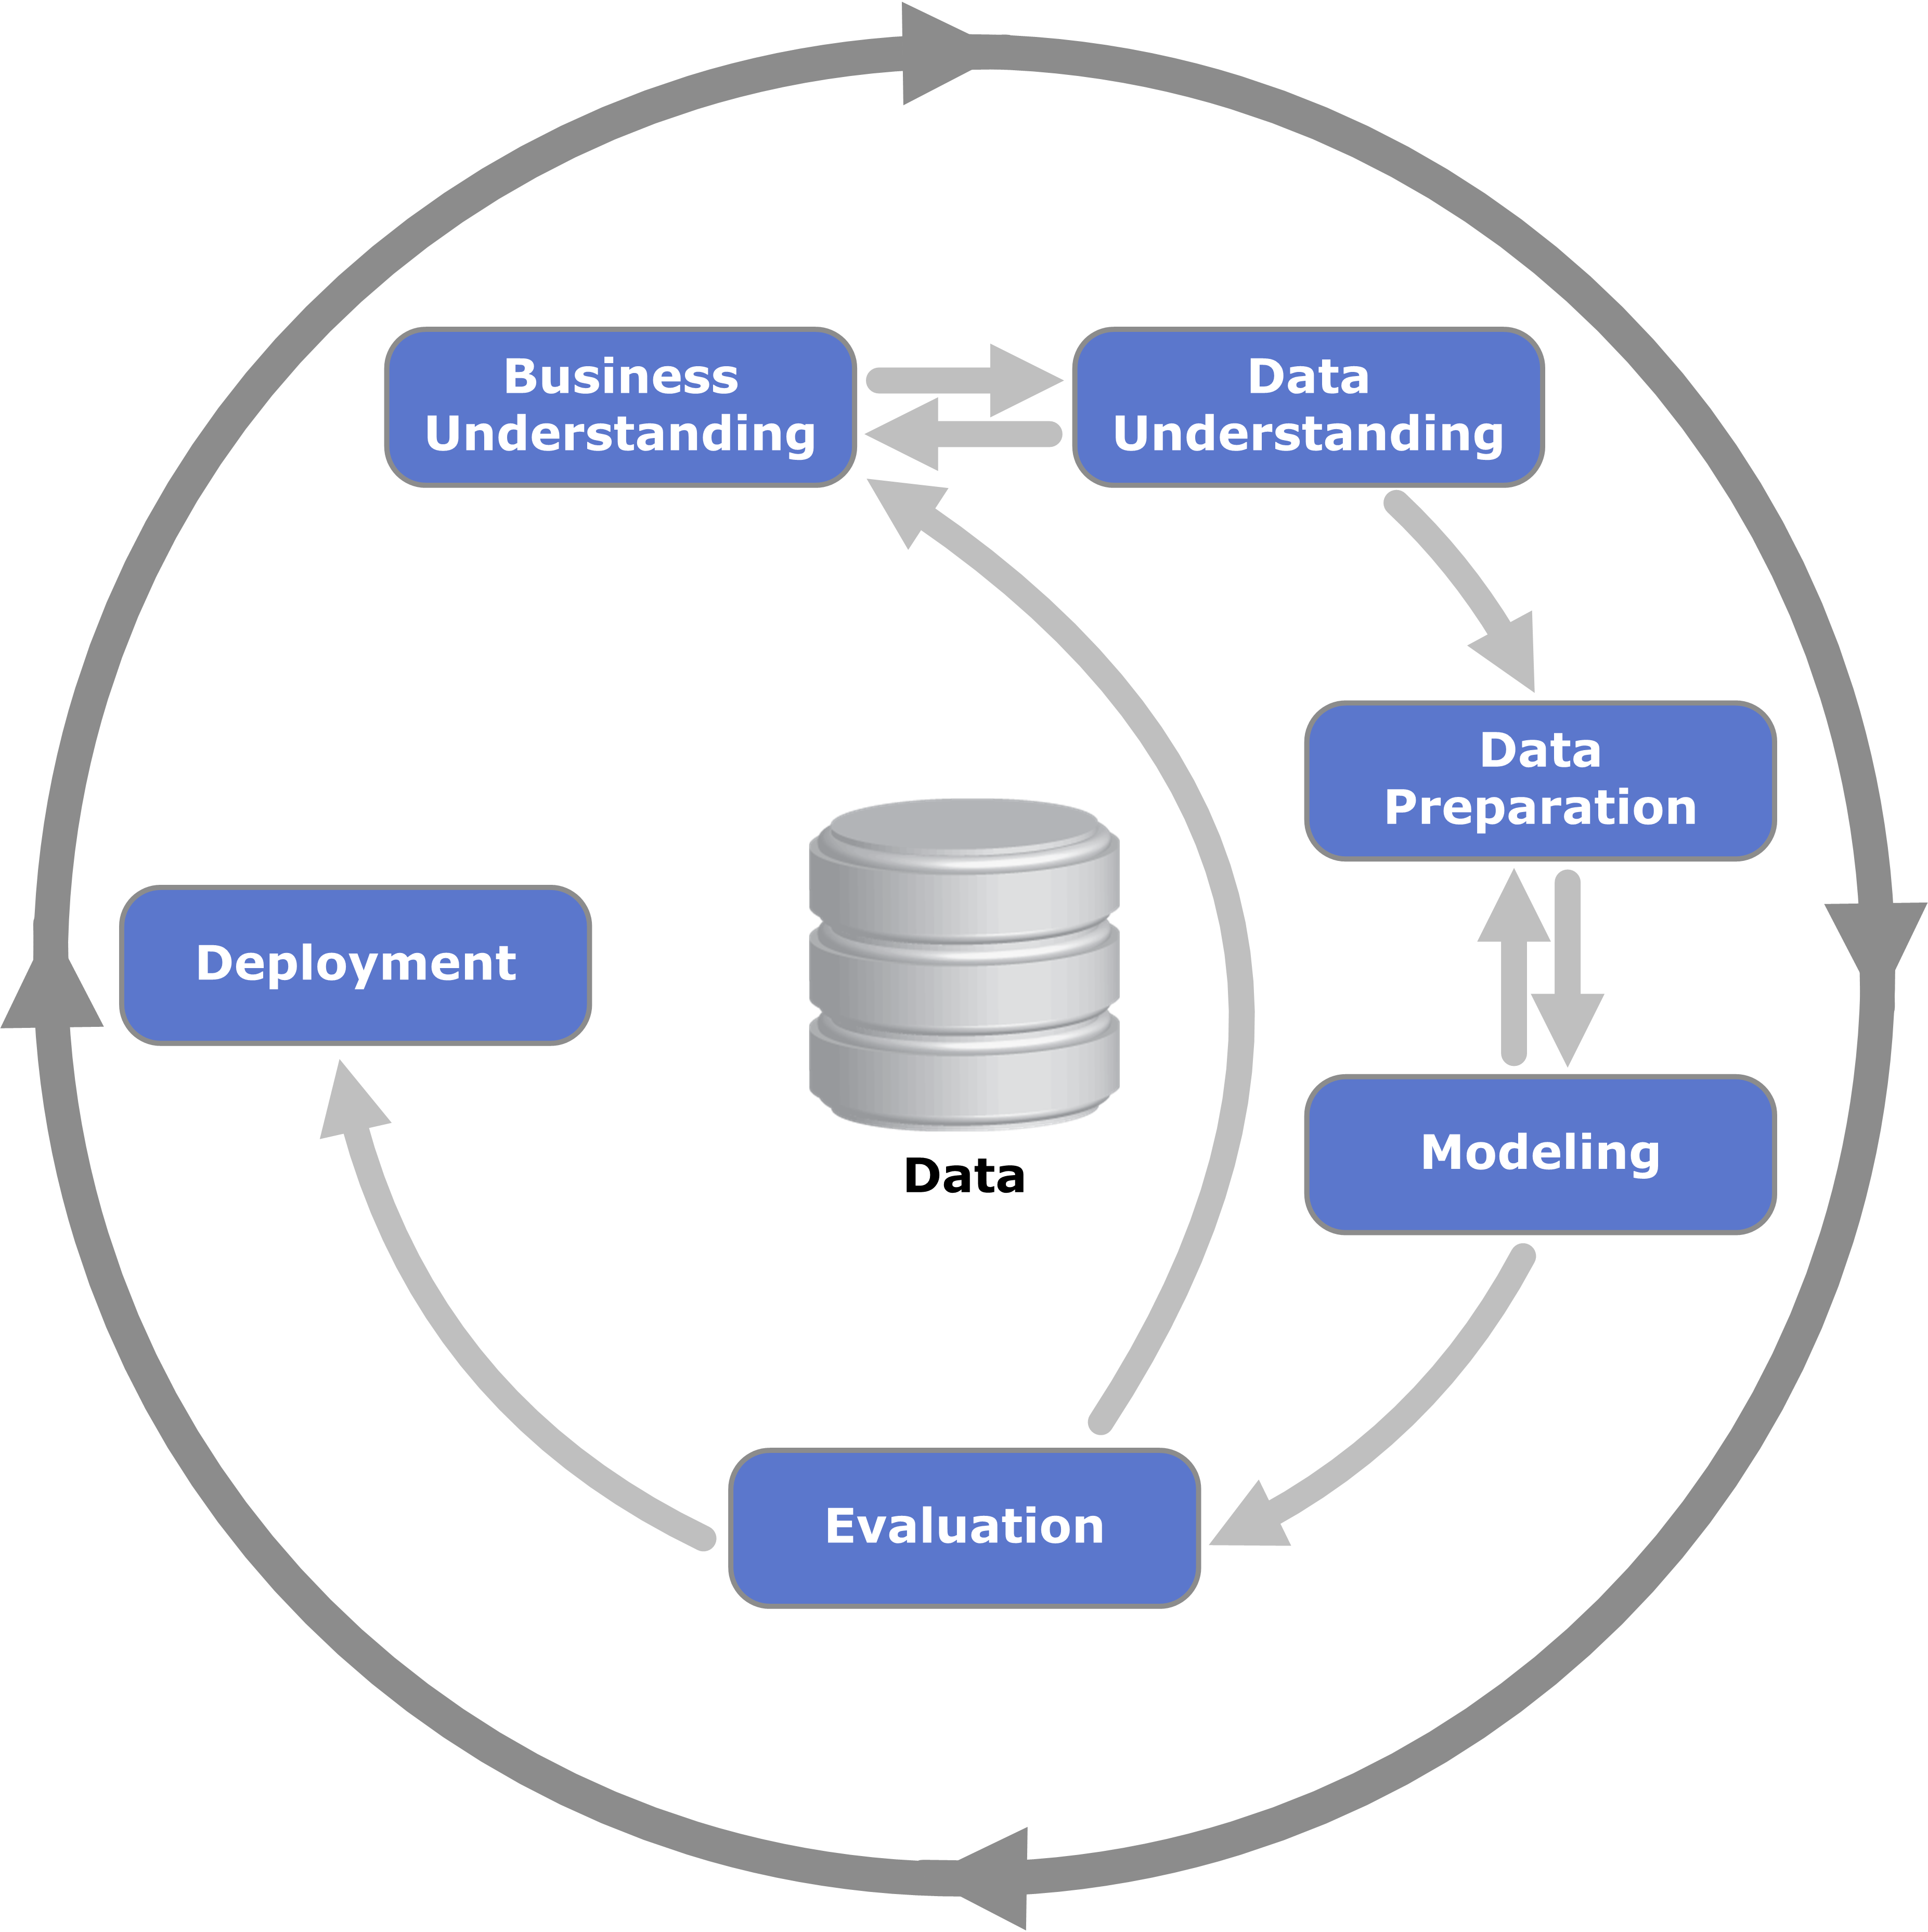
CRISP DM
Examples of ML applications
by domain
- WEB
- Web-page ranking
- Spam filtering
- e-mails, web pages in search results
Computer networks
- Authentication systems
- by voice, face, fingerprint
- by behavior
- Intrusion detection
- Authentication systems
Business
- Fraud detection
- Churn prediction
Banking
- Credit scoring
- Stock prices forecasting
- Risks estimation
by data type
- Texts
- Document classification
- POS tagging, semantic parsing
- named entities detection
- sentimental analysis
- automatic summarization
- Images
- Handwriting recognition
- Face detection, pose detection
- Person identification
- Image classification
- Image segmentation
- Adding artistic style
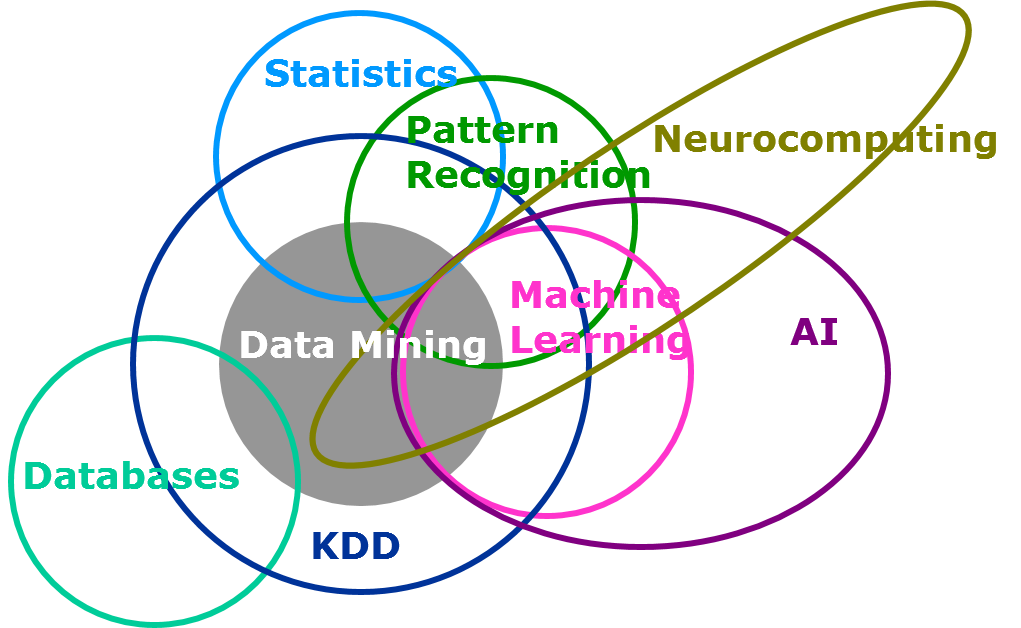
Connection of ML with other fields
- Pattern recognition
- recognize patterns and regularities in the data
- Computer science
- Artificial intelligence
- create devices capable of intelligent behavior
- Time-series analysis
- Theory of probability, statistics
- when relies upon probabilistic models
- Optimization methods
- Theory of algorithms
Back to our course
What we will do
- We will learn theoretical and practical aspects of some machine learning methods like:
- Supervised: k-nn, Linear and Logistic Regresion, Decesion Trees, Boosting ...
- Unupervised: k-means, hierarchical clustering, dbscan, dimension reduction techniques
- Learn to use varius techniques for data preprocessing
- Try to apply it all on real world datasets
- Run kaggle competition
- Understanding through implementation!
What we won't do
- Deep Neural Nets, Recurrent Nets, GANS =(
- Reinforcement Learning =(
Notations used in the course
- General definitions:
- $D$ - dimensionality of the feature space: $x\in\mathbb{R}^{D}$
- $N$ - the number of objects in the training set
- $C$ - total number of classes in classification.
- Possible classes: $\{1,2,...C\}$ or $\{\omega_{1},\omega_{2},...\omega_{C}\}$
- Objects and outputs:
- $x$ - vector of known input characteristics of an object
- $y$ - predicted target characteristics of an object specified by~$x$
- $x_{i}$ - $i$-th object of a set, $y_{i}$ - corresponding target characteristic
- $x^{k}$ - $k$-th feature of object specified by $x$
- $x_{i}^{k}$ - $k$-th feature of object specified by $x_{i}$
- Training set:
- $X$ - design matrix, $X\in\mathbb{R}^{NxD}$
- $Y\in\mathbb{R}^{N}$ - target characteristics of a training set
- Optimization:
- $\mathcal{L}(\widehat{y},y)$ - loss function for 1 object
- $y$ is the true value and $\widehat{y}$ is the predicted value.
- $L(\theta)=\sum_{n=1}^{N}\mathcal{L}(f_{\theta}(x_{n}),y_{n})$ loss function for the whole the training set.
- $\mathcal{L}(\widehat{y},y)$ - loss function for 1 object
- Special functions:
- $[x]_{+}=\max\{x,0\}$
- $\mathbb{I}[\text{condition}]=\begin{cases} 1, & \text{if condition is satisfied}\\ 0, & \text{if condition is not satisfied} \end{cases}$
- $sign(x)=\begin{cases} 1, & x\ge0\\ -1, & x<0 \end{cases}$
- Other definitions:
- $\widehat{z}$ defines an estimate of $z$, based on the training set: for example, $\widehat{\theta}$ is the estimate of $\theta$, $\widehat{y}$ is the estimate of $y$, etc.
- r.v.=random variable, w.r.t.=with respect to, e.g.=for example.
- $A\succcurlyeq0$ means that $A$ is a square positive semi-definite matrix.
- All vectors are vectors-columns, e.g. if $x\in\mathbb{R}^{D}$ its dimensions are $Dx1$.
Summary
- Machine learning algorithms reconstruct relationship between features $x$ and outputs $y$.
- Relationship is reconstructed by optimal function $\widehat{y}=f_{\widehat{\theta}}(x)$ from function class $\{f_{\theta}(x),\,\theta\in\Theta\}$.
- $\theta$ is particular controls model complexity, models may be too simple and too complex.
- $\widehat{\theta}$ selected to minimize empirical risk $\frac{1}{N}\sum_{n=1}^{N}\mathcal{L}(f_{\theta}(x_{n}),y_{n})$ for some loss function $\mathcal{L}(\widehat{y},y)$.
- Overfitting - non-realistic estimate of expected loss on the training set.
- To avoid overfitting - use validation sets, cross-validation, A/B test.