Data Analysis
Andrey Shestakov (avshestakov@hse.ru)
Intoduction1
1. Materials used from machine learning course of Victor Kitov
Some Friendly Faces
Lectures: Andrey Shestakov |
Seminars: Mikhail Gushin |
Seminars: Radomir Britkov |
Seminars: Leyla Khatbullina |
Seminars: Leonid Matyushin |
TAs: Natalia Zubkova, Anna Starovoyt, Anna Karbovskaya
Course information
Structure:
Evaluation:
- cumulative score = 0.8 $S_{\text{homework}}$ + 0.2 $S_{\text{colloq}}$+ 0.2 * $S_{\text{competition}}$
- score = 0.7 $S_{\text{cumulative}}$ + 0.3 $S_{\text{exam}}$
Tools
- python 3
- Jupyter Notebook
- numpy, scipy, pandas
- matplotlib, seaborn
- scikit-learn and more
Recommended materials
- The Elements of Statistical Learning: Data Mining, Inference, and Prediction Trevor Hastie, Robert Tibshirani, Jerome Friedman
- Data Mining: The Textbook Charu C. Aggarwal, Springer, 2015.
- Mining Massive Datasets Jure Leskovec, Anand Rajaraman, Jeff Ullman
- Statistical Pattern Recognition. 3rd Edition, Andrew R. Webb, Keith D. Copsey, John Wiley & Sons Ltd., 2011.
- Vorontsov's SHAD video lectures (Russian).
- Vorontsov's textual lectures (Russian).
- Any additional public sources:
- wikipedia, articles, tutorials, video-lectures.
- Practical questions:
Plan 4 today
- Motivation to learn data analysis (data science, machine learning)
- Get used to some notations
- Problem types
- Feature types
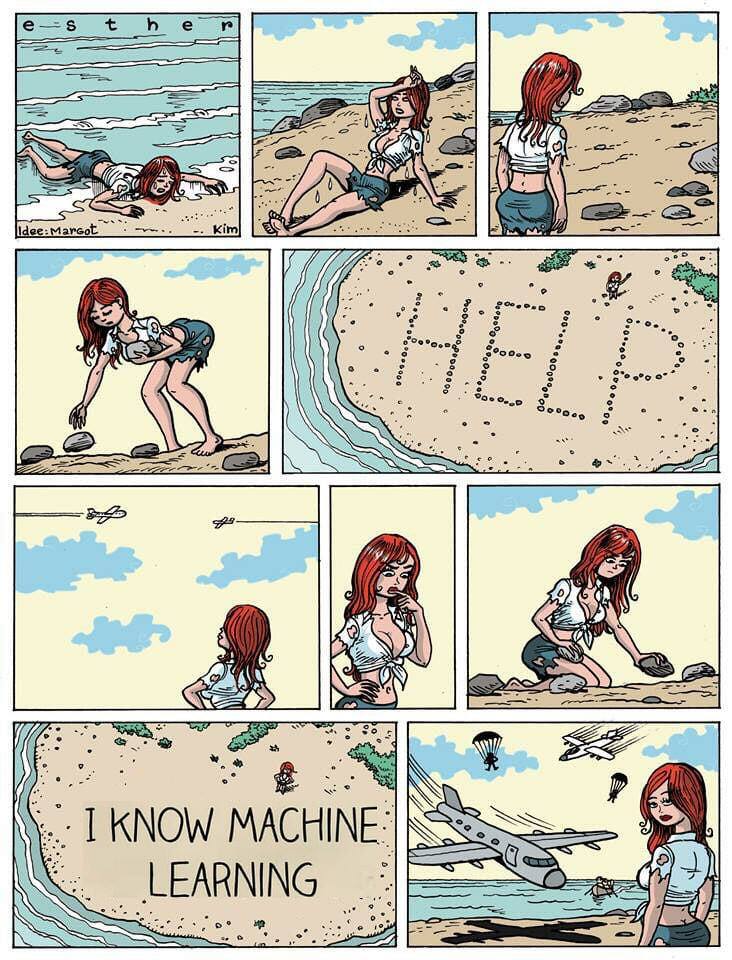
- Some fundamental terminology, pics and memes
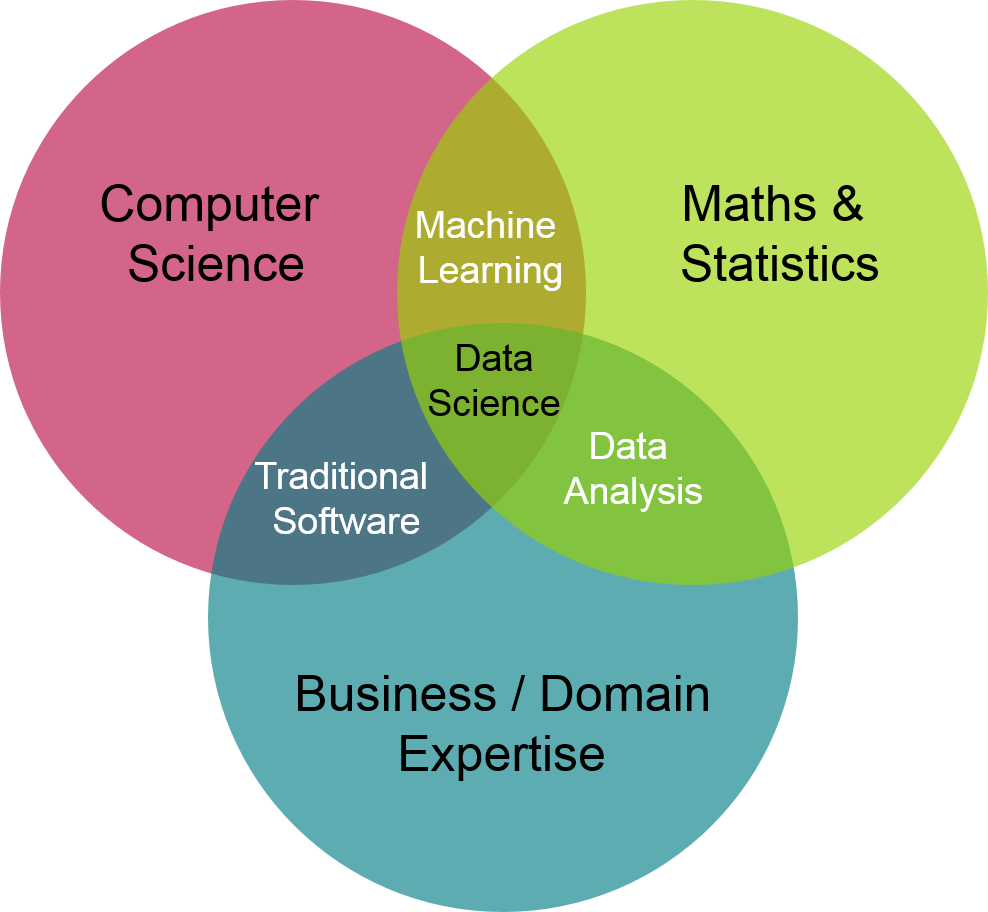
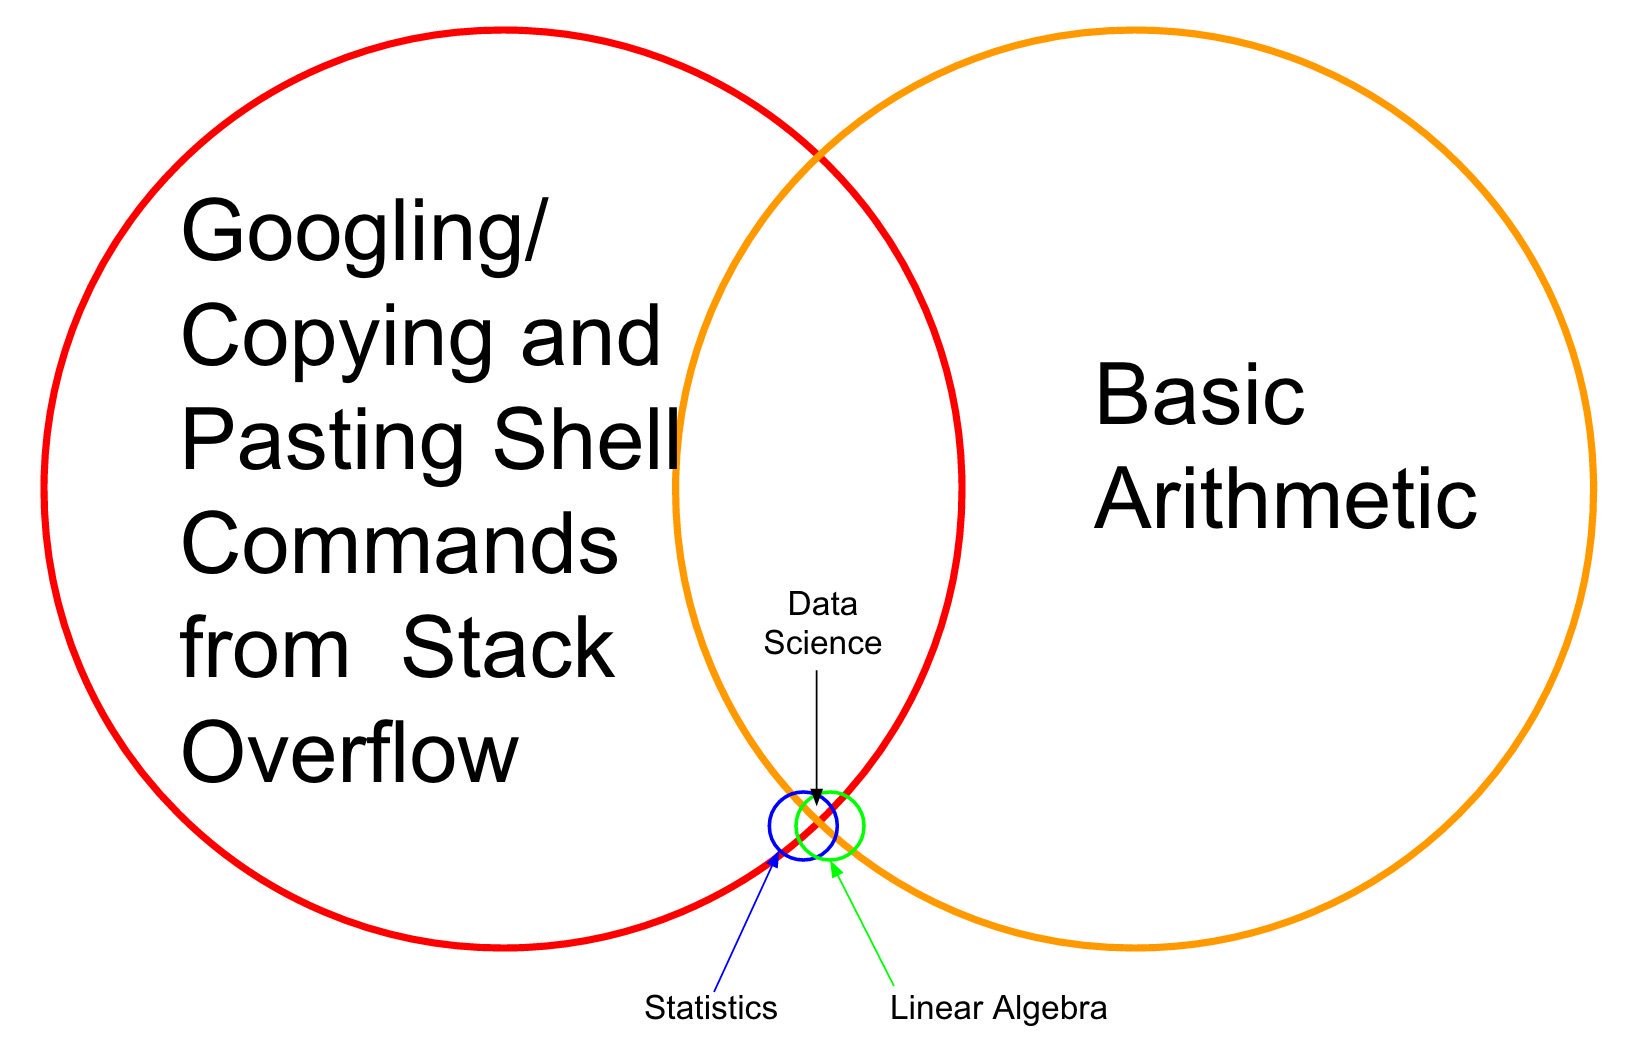
Motivation
Motivation

Motivation
YouTubeVideo('zvGeLvWZ7yQ', width=700, height=600)
Motivation
- Data scientist is a highly wanted and well-paid specialization.
- Apply boring calculus, linear algebra and statistics to problem solving.
- Should use machine learning "apparatus" to extract knowledge from data.
Machine learning?
- Machine learning is a field of study that gives computers the ability to learn without being explicitly programmed.

Examples
Spam filtering
- if sender belongs to black-list -> spam
- if contains phrase 'buy now' and sender is unknown -> spam
- ...
Part-of-speech tagger.
- if ends with 'ed' -> verb
- if previous word is 'the' -> noun
- ...
- ML finds decision rules automatically with labelled data!
Formal problem statement
- Set of objects $O$
- Each object is described by a vector of known characteristics $\mathbf{x}\in\mathcal{X}$ and predicted characteristics $y\in\mathcal{Y}$. $$ o\in O\longrightarrow(\mathbf{x},y) $$
- Task: find a mapping $f$, which could accurately approximate $\mathcal{X}\to\mathcal{Y}$.
- using a finite known set of objects (learning)
- apply model for objects from the test set (prediction)
- understand revealed relationships in data (inference, interpretation)
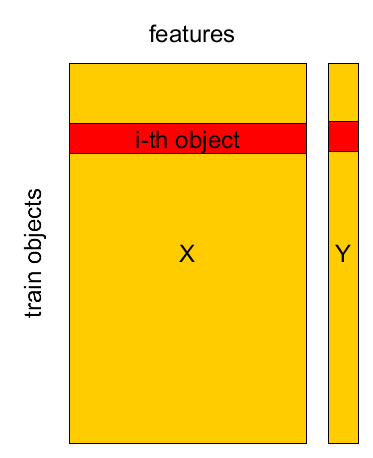
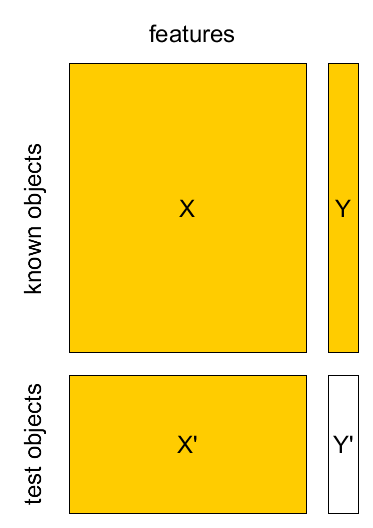
Known Set
Known set: $(\mathbf{x}_{1},y_{1}),...(\mathbf{x}_{M},y_{M})$
design matrix $X=[\mathbf{x}_{1},...\mathbf{x}_{M}]^{T}$, $Y=[y_{1},...y_{M}]^{T}$.
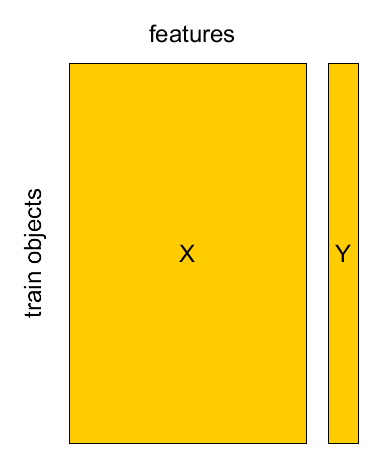
Known Set
Known set: $(\mathbf{x}_{1},y_{1}),...(\mathbf{x}_{M},y_{M})$
design matrix $X=[\mathbf{x}_{1},...\mathbf{x}_{M}]^{T}$, $Y=[y_{1},...y_{M}]^{T}$.
Known Set
Known set: $(\mathbf{x}_{1},y_{1}),...(\mathbf{x}_{M},y_{M})$
design matrix $X=[\mathbf{x}_{1},...\mathbf{x}_{M}]^{T}$, $Y=[y_{1},...y_{M}]^{T}$.
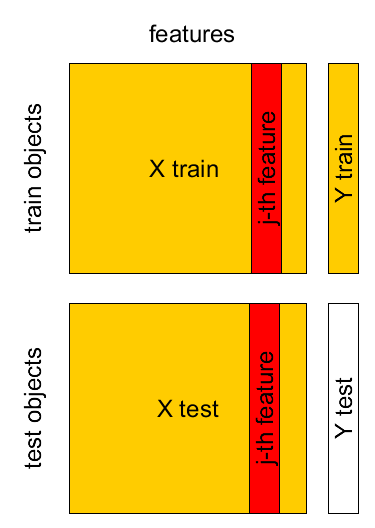
Test set
- Known sample $X,Y$: $(\mathbf{x}_{1},y_{1}),...(\mathbf{x}_{M},y_{M})$
- Test sample $X',Y'$: $(\mathbf{x}_{1}',y_{1}'),...(\mathbf{x}_{K}',y_{K}')$
Specification of ML tasks
- supervised learning: $(\mathbf{x}_{1},y_{1}),(\mathbf{x}_{2},y_{2}),...(\mathbf{x}_{N},y_{N})$
- e.g. regression, classification.
- unsupervised learning: $\mathbf{x}_{1},\mathbf{x}_{2},...\mathbf{x}_{N}$
- e.g. dimensionality reduction, clustering, outlier analysis, topic modelling
Toy examples
Regression 1
Regression 2
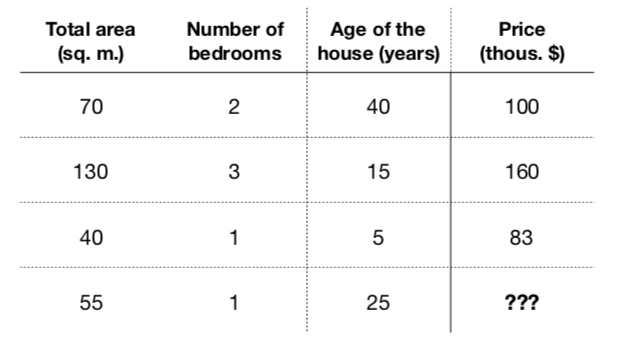
- Obviously, those characteristics somehow relate with price ($f: X \rightarrow Y$)
- Formalize a model to predict flat price: $$a(x) = a(total\_area, nmbr\_of\_bedrooms, house\_age) = \hat{y}$$
- Let it be a linear model: $$a(x) = w_0 + w_1\cdot total\_area + w_2 \cdot nmbr\_of\_bedrooms + w_3 \cdot house\_age$$
- Learning - find coefficients $w_0,\dots, w_3$, that minimizer error on training set
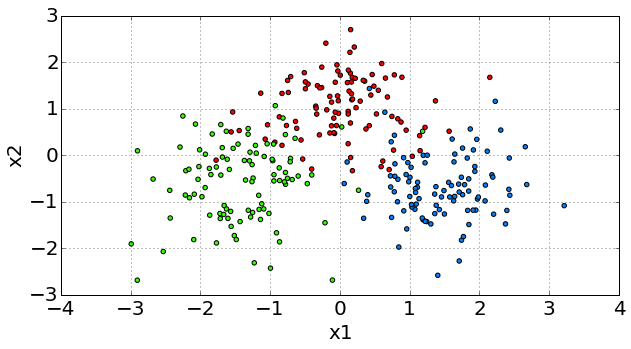
Classificaion 1

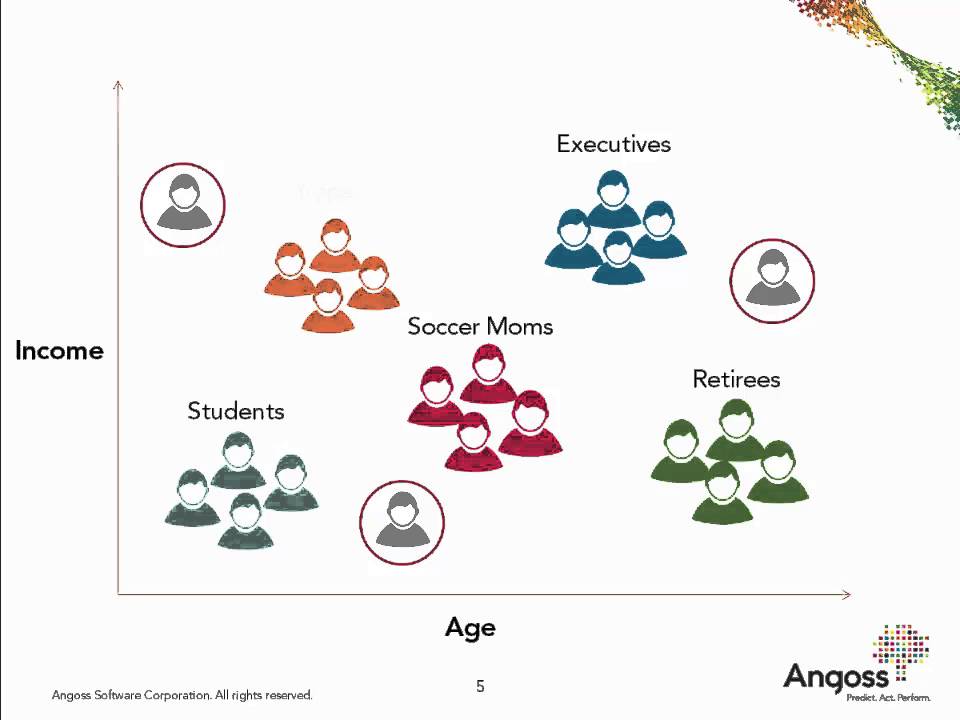
Unsupervised Learning. Clustering
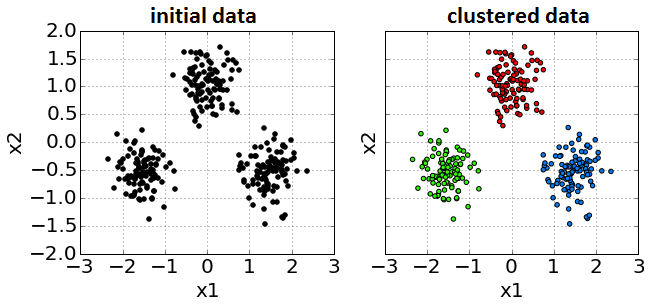
Clustering
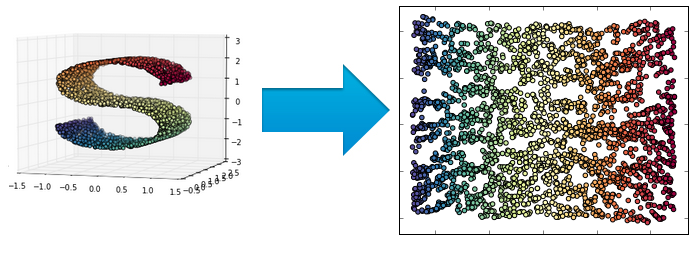
Unsupervised Learning. Dimensionality reduction
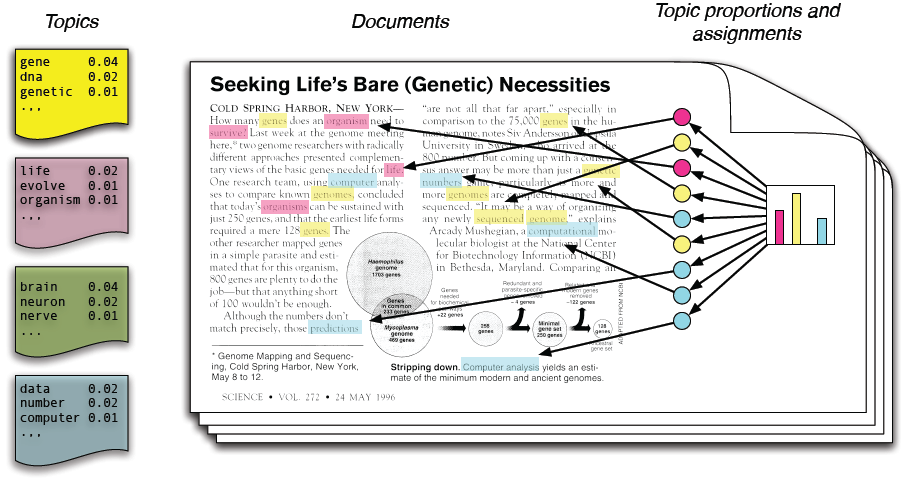
Unsupervised Learning. Topic modelling
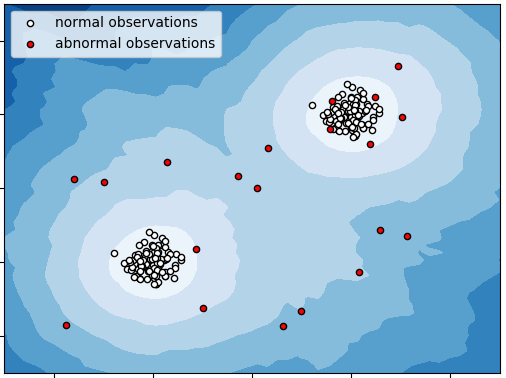
Outlier Detection Task
Recommender Systems
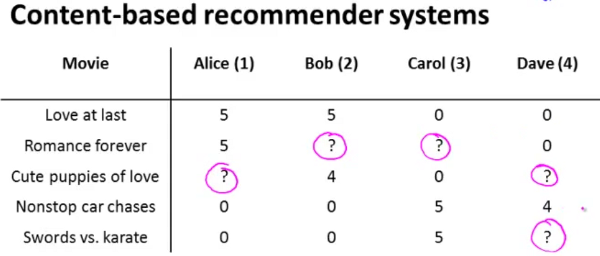
Recommender Systems

Ranking

Reinforcement learning
- RL setup:
- a set of environment and agent states $S$;
- a set of actions $A$, of the agent
- $P(s_{t+1}=s'|s_{t}=s,a_{t}=a)$ is the probability of transition from state s to state s' under action a.
- $R_{a}(s,s')$ is the (expected) immediate reward after transition from $s$ to $s'$ with action $a$.
- Well-suited to problems which include a long-term versus short-term reward trade-off
- Applications: robot control, elevator scheduling, games (chess, go, DOTA), etc.
YouTubeVideo('V1eYniJ0Rnk', width=700, height=600)
General Problem Statement
We want to approximate $f(x):\,X\to Y$
Questions in ML:
- what target $y$ we are predicting?
- how to select object descriptors (features) $x$?
- what type of mapping $f$?
- in what sense a mapping $f$ should approximate true relationship?
- how to tune $f$?
What target $y$ we are predicting?
Types of target variable (supervised learning)
- $\mathcal{Y}=\mathbb{R}$ - regression
- e.g. flat price
- $\mathcal{Y}=\mathbb{R}^{M}$ - vector regression
- e.g. stock price dynamics
Types of target variable (supervised learning)
- $\mathcal{Y}=\{\omega_{1},\omega_{2},...\omega_{C}\}$ - classification.
- C=2: binary classification.
- e.g. spam / not spam (ham)
- C>2: multi-class classification
- e.g. identity recognition, activity recognition
- $\mathcal{Y}$ - any subset of $\{\omega_{1},\omega_{2},...\omega_{C}\}$ - labeling
- e.g. news categorization
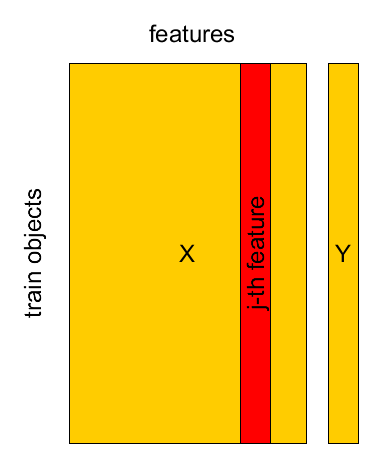
How to select object descriptors (features) 𝑥?
Types of features
- Full object description $\mathbf{x}\in\mathcal{X}$ consists of individual features $x^{i}\in\mathcal{X}_{i}$
- Types of feature (e.g. for credit scoring):
- $\mathcal{X}_{i}=\{0,1\}$ - binary feature
- e.g. marital status
- $|\mathcal{X}_{i}|<\infty$ - categorical (nominal) feature
- e.g. occupation
- $|\mathcal{X}_{i}|<\infty$ and $\mathcal{X}_{i}$ is ordered - ordinal feature
- e.g.education level
- $\mathcal{X}_{i}=\mathbb{R}$ - continuous feature
- e.g. age
- $\mathcal{X}_{i}=\{0,1\}$ - binary feature
Credit scoring
- Objects — credit applicantion
- Target — return credit of not
- Kind of task and features?
Credit scoring
- Binary: sex,
- Categorical: living region, profession, marital status
- Ordinal: education level, work grade
- Continuous: age, wage
Churn prediction
- Object — online game user
- Target — will he/she lose interest in playing after 2 weeks?
- Kind of task and features?
Churn prediction
- Binary: premium user
- Categorical: avatar class, game plan
- Continuous: average playing hours per day, number of characters, chat activity
Learning = Representation + Evaluation + Optimization
A Few Useful Things to Know about Machine Learning // Pedro Domingos
Model Class (Representation)
Linear Example
- Function class - parametrized set of functions $F=\{f_{\theta},\,\theta\in\Theta\}$,
from which the true relationship $\mathcal{X}\to\mathcal{Y}$ is approximated.
- Regression: $\widehat{y}=f(x|\theta)$,
- Classification: $\widehat{y}=f(x|\theta)=\arg\max_{c}\left\{ g_{c}(x|\theta)\right\} $, $c=1,2,...C$.
- $c=1,2,...C$: possible classes, $g_{c}(x)$ - score of class $c$, given $x$ called discriminant function
Examples
linear regression $y\in\mathbb{R}$: $$f(x\mathbf{|\theta})=\theta_{0}+\theta_{1}x$$ 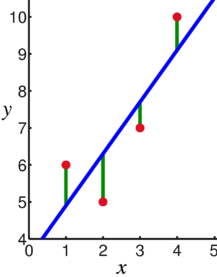 |
linear classification $y\in\{1,2\}$:
\begin{align*}
g_{c}(\mathbf{x}|\theta) & =\theta_{c}^{0}+\theta_{c}^{1}x^{1}+\theta_{c}^{2}x^{2},\,c=1,2.\\
f(\mathbf{x|\theta}) & =\arg\max_{c}g_{c}(x|\theta)
\end{align*}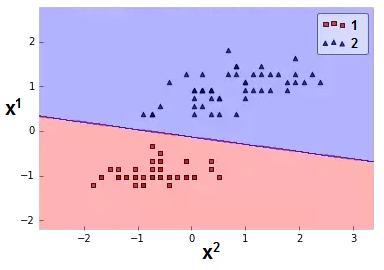 |
|---|
Loss function vs model quality (Evaluation)
- In machine learning models try to optimize some function, which you can call:
- score, rating - if you are maximizing
- loss, cost, error - if you are minimized
- both score and loss can be computed for individual objects
- directly optimized in model
- Model quality measures are used to compare diffrent models' performance on test set
- some of them can not be directly optimized in the model
- usually can not be computed for individual objects
Loss function $\mathcal{L}(\widehat{y},y)$
- regression:
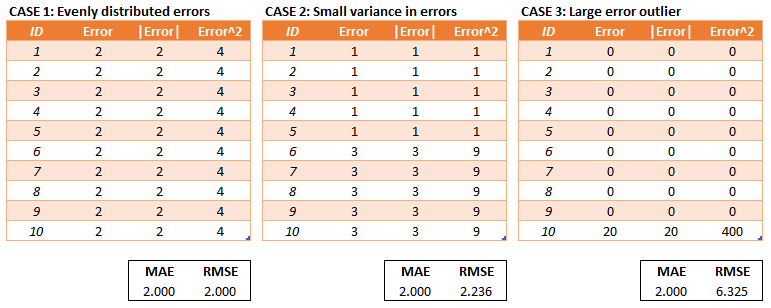
- MAE (mean absolute error): $$ \mathcal{L}(\widehat{y},y)=\frac{1}{N}\sum\limits_i\left|\widehat{y}_i-y_i\right| $$
- MSE (mean squared error): $$ \mathcal{L}(\widehat{y},y)=\frac{1}{N}\sum\limits_i\left(\widehat{y}_i-y_i\right)^{2} $$
- classification:
- log-loss $$ \mathcal{L}(\widehat{y},y)=\mathbb{I}[y==1]\log\left(p(\hat{y} = 1)\right) + \mathbb{I}[y==-1]\log\left(p(\hat{y}=-1)\right) $$
plt.plot(h, L1, label='logloss if y = +1')
plt.plot(h, L2, label='logloss if y = -1')
plt.ylabel('logloss')
plt.xlabel('classifier probability of +1')

_ = plt.legend()

Optimization
 |
 |
|---|
How to tune $f$?
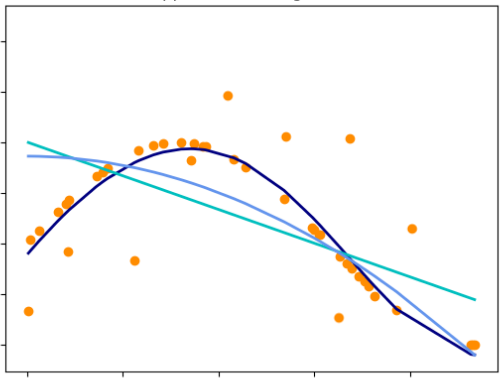
Overfitting - Underfitting
- Theoretically, a very complex model can achive perfect quality on training dataset
- Profit???
- Nope...
Overfitting - Underfitting
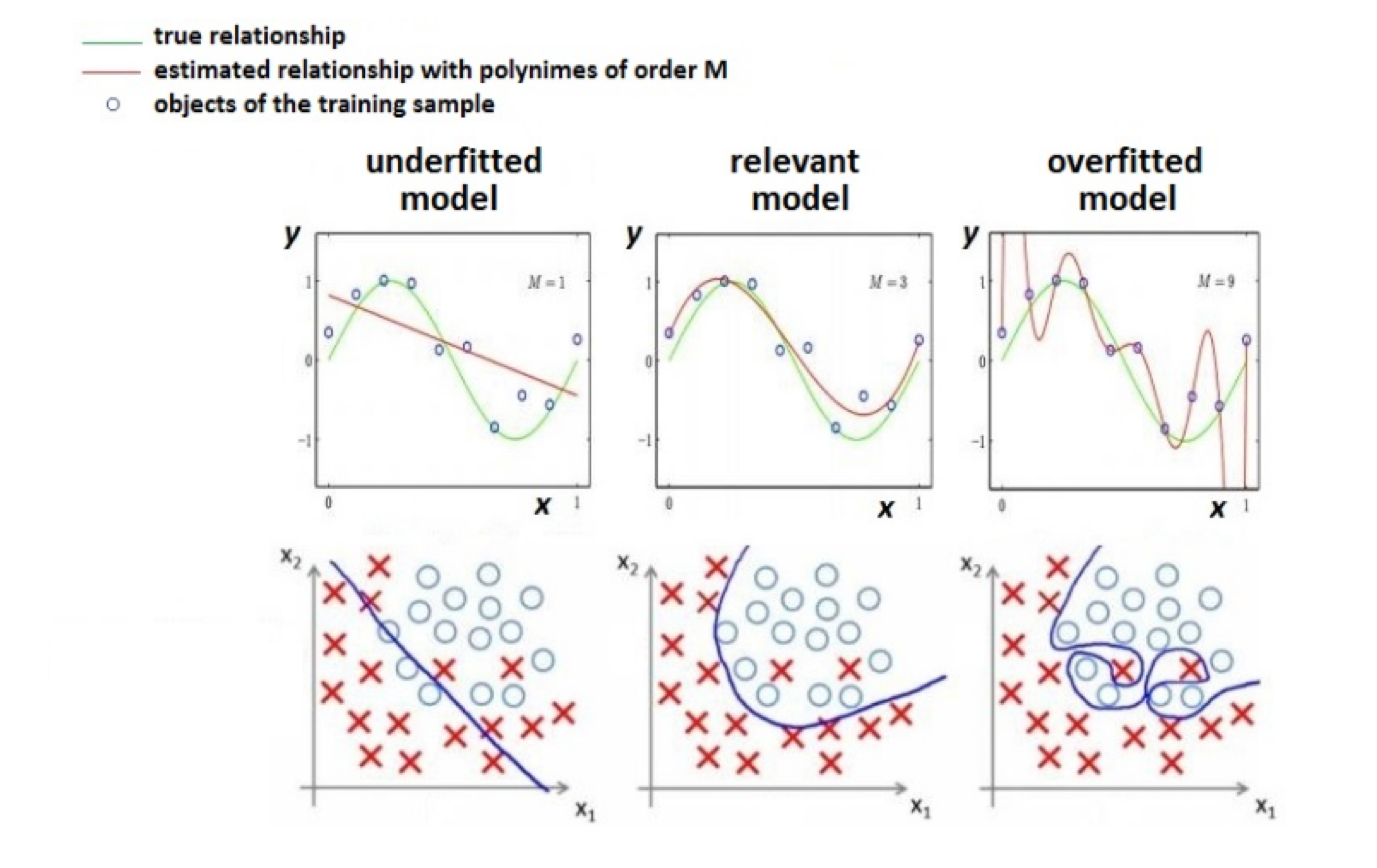
Empirical risk
- Want to minimize expected risk: $$ \mathit{\int}\int\mathit{\mathcal{L}(f_{\theta}(\mathbf{x}),y) \cdot p(\mathbf{x},y)d\mathbf{x}dy\to\min_{\theta}} $$
In fact we have only $X$,$Y$ (Known set) and $X'$ (Test set)
Can minimize empirical risk $$ L(\theta|X,Y)=\frac{1}{N}\sum_{n=1}^{N}\mathcal{L}(f_{\theta}(\mathbf{x}_{n}),\,y_{n}) $$
Method of empirical risk minimization: $$ \widehat{\theta}=\arg\min_{\theta}L(\theta|X,Y) $$
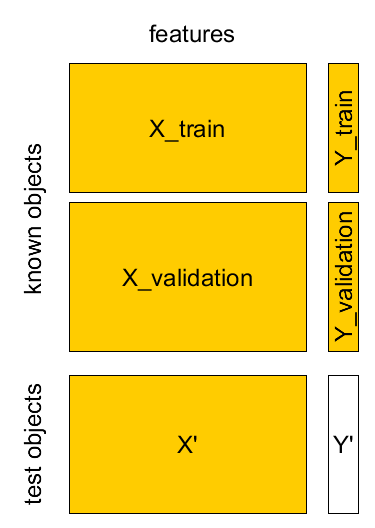
- How to get realistic estimate of $L(\widehat{\theta}|X',Y')$?
- separate validation set
- cross-validation
- leave-one-out method
Separate validation set
- Known sample $X,Y$: $(\mathbf{x}_{1},y_{1}),...(\mathbf{x}_{M},y_{M})$
- Test sample $X',Y'$: $(\mathbf{x}_{1}',y_{1}'),...(\mathbf{x}_{K}',y_{K}')$
Cross-validation
4-fold cross-validation example
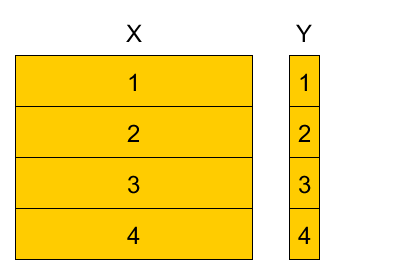
Divide training set into K parts, referred as folds (here $K=4$).
Variants:
- randomly
- randomly with stratification (w.r.t target value or feature value)
- randomly with respect to time domain
- etc
4-fold cross-validation example
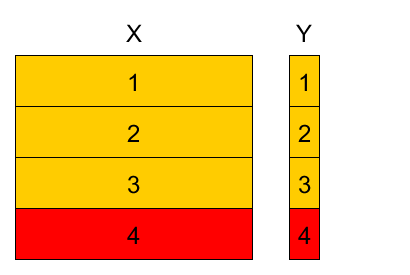
4-fold cross-validation example
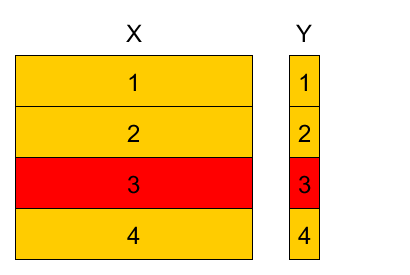
4-fold cross-validation example
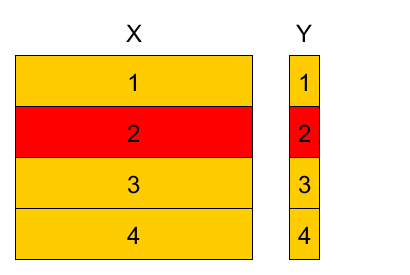
4-fold cross-validation example
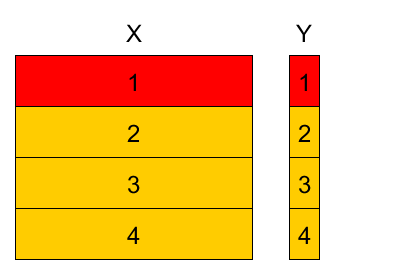
4-fold cross-validation example
- Denote
- $k(n)$ - fold to which observation $(\mathbf{x}_{n},y_{n})$ belongs $n\in I_{k}$.
- $\widehat{\theta}^{-k}$ - parameter estimation using observations from all folds except fold $k$.
Cross-validation empirical risk estimation
$$\widehat{L}_{total}=\frac{1}{N}\sum_{n=1}^{N}\mathcal{L}(f_{\widehat{\theta}^{-k(n)}}(x_{n}),\,y_{n})$$For $K$-fold CV we have:
- $K$ parameters $\widehat{\theta}^{-1},...\widehat{\theta}^{-K}$
- $K$ models $f_{\widehat{\theta}^{-1}}(\mathbf{x}),...f_{\widehat{\theta}^{-K}}(\mathbf{x}).$
$K$ estimations of empirical risk: $\widehat{L}_{k}=\frac{1}{\left|I_{k}\right|}\sum_{n\in I_{k}}\mathcal{L}(f_{\widehat{\theta}^{-k}}(\mathbf{x}_{n}),\,y_{n}),\,k=1,2,...K.$
- can estimate variance & use statistics!
Comments on cross-validation
- When number of folds $K$ is equal to number of objects $N$, this is called leave-one-out method.
- Cross-validation uses the i.i.d.(independent and identically distributed) property of observations
- Stratification by target $y$ helps for imbalanced/rare classes.
A/B testing
A/B testing
- Observe test set after the models were built.
- A/B testing procedure:
- divide test objects randomly into two groups - A and B.
- apply base model to A
- apply modified model to B
- compare final results\pause
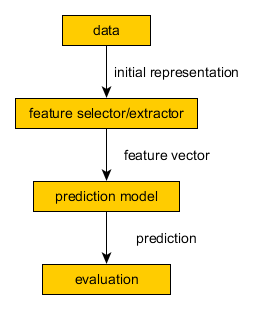
Modelling Pipelines
General Modelling Pipeline
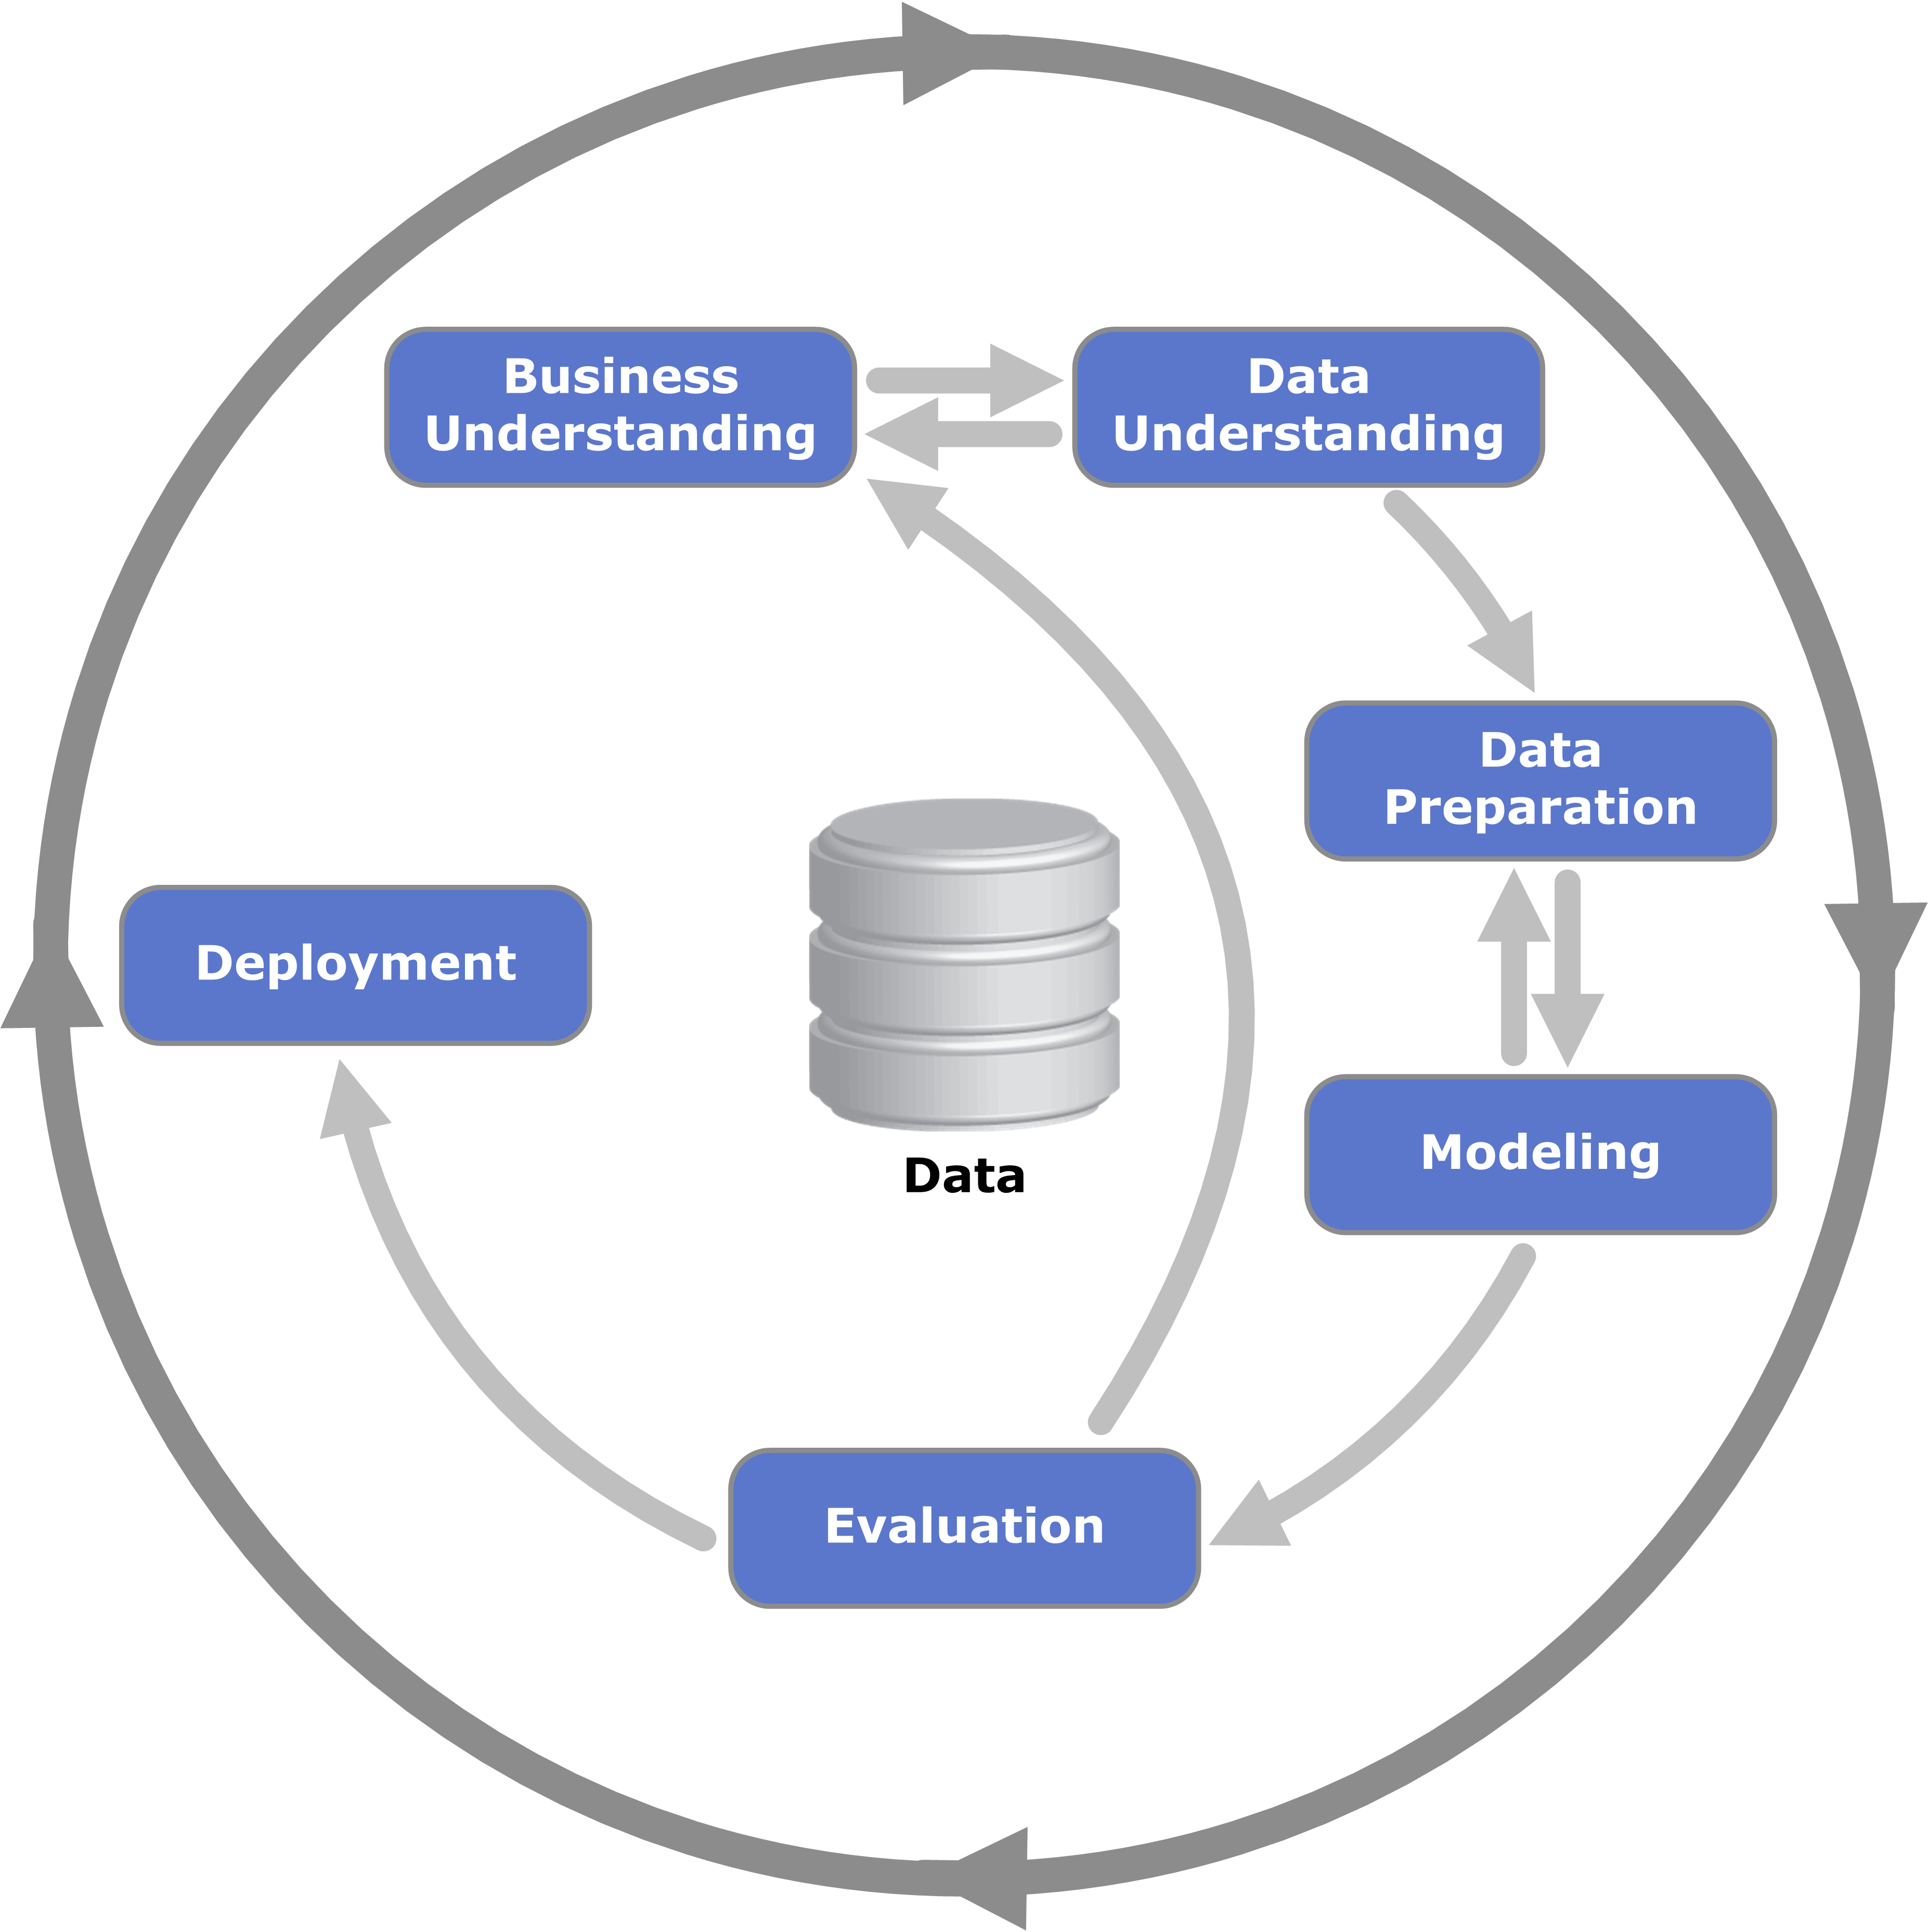
CRISP DM
Summary
- Machine learning algorithms reconstruct relationship between features $x$ and outputs $y$.
- Relationship is reconstructed by optimal function $\widehat{y}=f_{\widehat{\theta}}(x)$ from function class $\{f_{\theta}(x),\,\theta\in\Theta\}$.
- $\theta$ is particular controls model complexity, models may be too simple and too complex.
- $\widehat{\theta}$ selected to minimize empirical risk $\frac{1}{N}\sum_{n=1}^{N}\mathcal{L}(f_{\theta}(x_{n}),y_{n})$ for some loss function $\mathcal{L}(\widehat{y},y)$.
- Overfitting - non-realistic estimate of expected loss on the training set.
- To avoid overfitting - use validation sets, cross-validation, A/B test.